

Data Image has embarked on a Value Stream Mapping journey with Esko to make its business more efficient. Should you be applying this type of lean process?
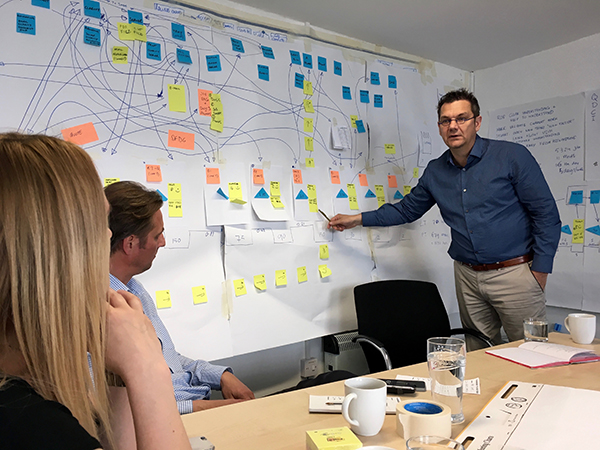
I am sat in the ‘war room’, strategic manoeuvres pinned to wall charts all around me, with top level staff convened to discuss action plans. The aim - to make £5m turnover Leicester-based Data Image a more efficient company.
It’s a project that began 18 months ago and has now reached a critical stage, today’s agenda being to get from ‘current state’ figures gathered across the company at the start of this Value Stream Mapping (VSM) process, to drafting a ‘future state map’ and devising an ‘action plan’ on how to meet objectives.
In the room are Data Image MD Robert Farfort, operations manager Mark Poyser, the company’s consultant programmer Rupert Barraclough, and finishing manager Iwona Baraniuk - the latter being key to the discussion given that finishing is where this project started! They are joined by Esko’s Stuart Fox, director of digital finishing, and Frank Adegeest,director of R&D and product management and VSM proponent.
Farfort explains: “It’s easy to develop your company by increasing head count in various departments. But is that really how we want to grow - or should we be looking at our processes and looking at how to improve them? We’re known as early adopters, and we’ve always been interested in automation and what it can achieve for the business. Ten years ago we got involved in software automation with Artwork Systems - now part of Esko - and over the years we’ve worked closely with them.
“We actually started with Zund machines in he finishing department years ago, but in 2013 we put in our first Kongsberg machine and we started talking to Esko about automation and improving the finishing workflow. And we got to the question: do we really need faster cutting etc., or are there other workflow issues where lean processes could make a difference? Stuart [Fox] suggested that we get Frank [Adegeest] over and look at VSM. He’s really process driven and has helped us understand where our problems are.”
Farfort continues: “From that initial meeting we started to talk a different language internally. We tend to be quite woolly when we talk about our businesses, but the print industry needs to be harder nosed and better understand the whole process - not just printing kit technology - in terms of numbers etc.”
At that first meeting questions were asked of Data Image’s teams right across the company, and data gathered to provide a ‘current state map’ for VSM purposes. That data immediately flagged up some issues, and as Farfort says, “we’ve already made significant changes within the company since then. Where we could see waste we’ve talked to staff to see what the issues are and worked on not just product flow, but information flow. And we have created a VSM dashboard so we can see how to better run the business.”
“The thing to stress is that the numbers tell you where to focus your efforts. VSM forces you to think holistically,” adds Adegeest. “There’s no point creating islands of success in a sea of waste!”
“And we have experienced that in estimating, where changes created by that team to help them caused chaos in the rest of the company. They just didn’t understand the downflow of their actions,” says Poyser.
“The thing is, you can have ideas, but you need to be able to put actual numbers to things. At any company people have their own issues to deal with and so tend to be in their own little bubble. VSM makes you see the bigger picture,” responds Farfort.
After garnering that initial shopfloor/business team data across all the company’s processes 18 months ago, Data Image briefed Barraclough to build the VSM dashboard. “It’s about joining lots of systems together for business intelligence purposes largely. The dynamics of capturing data are constantly changing and we need live information,” says Farfort, who admits “we spend a lot of money on how we work from a data driven perspective.”
Couldn’t an MIS system do that? “Well, we use Clarity, but we find most MIS systems are not flexible/tailorable enough to give us good enough quality data right across the company,” answers Farfort.
In the ‘war room’ as Farfort himself calls the space dedicated to VSM wall charts, Adegeest kicks off what is his second meeting with Data Image a recap on the situation so far and sets out the day’s agenda - to craft a ‘future state map’ and ‘action plan’ by going through the numbers collated at the first briefing and defining priorities on how to address problematic areas highlighted therein.
“By analysing waste from those figures we will put together countermeasures [initially via suggestions from around the table jotted on PostIt’s and stuck to a wall chart] and then prioritise those. From there we will draw up a ‘future state map’ that will show what the new process will look like, and from there plot what the assumed impact will be on the numbers across the business. From that we’ll draft the ‘action plan’ [which has short and longer term actions],” enthuses Adegeest, pointing out that measuring the impact of the changes will start almost immediately as part of the last VSM step - ‘implement and sustain’.
“We will hold reviews after 30, 60 and 90 days,” explains Adegeest, but the key is to make sure you continually measure what you’re doing, and once this action plan is completed, perhaps the focus moves to drilling down deeper somewhere else in the business. Don’t try and boil the ocean. Make small improvements and get proof of sustainment otherwise people get excited then fall back into old ways,” he warns.
Data Image is already measuring the impact of changes implemented since Adegeest’s last visit. “One of the biggest impact has been on information flow,” says Farfort. “We’ve changed roles and responsibilities internally to make sure the right information gets to the right people at the right time, via automated and manual methods. We’ve invested in Qlik because we realised we needed to handle our information differently etc.”
He admits this VSM strategy is not a cheap option. “We’ve thrown huge amounts of money at this. The thing is, people have an issue with investing in their business in terms of information and software because it doesn’t make them anything. But we’re convinced that long term it will have a massive impact.”
What is Value Stream Mapping?
Esko’s parent, Danaher, a $16.9bn revenue global science and technology innovator, itself uses VSM as part of a toolset that enables continuous improvement focused on lean, growth and leadership. Frank Adegeest,director of R&D and product management at Esko, who recently conducted a workshop at theConsumer Goods Sales and Marketing Conference in New York, explains VSM like this:
Don’t be mistaken: ‘lean’ concepts and tools are not just for the manufacturing floor. A diverse array of professionals is already realising the benefits of extending ‘lean’ methods into non-manufacturing functions. Just look at agile software development, agile marketing, and even agile careers: all stem from the rich source of the Toyota Production System (TPS). One of the fundamentals of TPS and ‘lean’ is ‘Value Stream Mapping’ (VSM), a powerful tool that can radically improve the flow of value in an operation.
VSM helps leaders see through minutiae to understand what is really affecting their business. By focusing on a company’s value creation workflow, it exposes the waste and delays that exist in the current, real-time state. It is a clarity-driving event, a point from which to improve complex, cross-functional operations, whether in a single building or across continents.
A value stream map is a visual representation of all the major process steps that create value for the customer and, in the end, complete a product or service. It is a representation of the current state of things, the real flow of materials and information from the customer’s request, through your organisation and to delivery to the customer. It is derived from empirical evidence: real facts and figures. The current state motivates you to create a future state map and compose concrete actions to achieve it.
Because it is based on real numbers gathered from the people who actually do the work, VSM is grounded in reality, not opinions. Taking a 10,000-foot perspective allows leaders to see and understand the entire workflow as a system of interconnected steps and activities, supported by real data. This big-picture perspective helps leaders set a strategy for improvement rather than trying to optimise on a piecemeal basis.
Remember, finding waste is a good thing. It creates opportunities to improve your productivity and throughput - and as a result, your profitability. It also helps avoid incrementalism.
Rather than simply addressing symptoms, or quieting the loudest voice in the room, VSM helps you dig deeper to base targeted actions on real data, giving you confidence that countermeasures will actually produce results.
Esko works with customers at a VSM level because it’s a two way street – providing each party with useful information. Adegeest says you can get to the action plan stage within two-and-a-half days.